Leverage Withe's hiring event platform
Streamline your seasonal and high-volume hiring process and hit your hiring targets.
We’re kicking off a 3-part series on the most important statistics related to talent acquisition. Today, we’re starting at the top of the talent acquisition funnel with job application statistics.
In this article, we’re going to explore application drop-off rates, the optimal number of questions to ensure a candidate will actually complete the application, what industries are seeing an uptick in applications, and what devices they're applying for roles on. With that said, let’s dive into 30+ interesting stats related to job applications!
Leverage Withe's hiring event platform
Streamline your seasonal and high-volume hiring process and hit your hiring targets.
Key Job Applications Statistics to Know
- 92% of candidates drop-off in the application process - over half quit because of application length or complexity
- Candidates are 38% more likely to accept a job offer if they are satisfied with the application process
- 55% of job seekers are rarely or never kept informed about their application status after completing an application
- Job descriptions containing 201-400 words have the highest apply rates of 8-8.5%
- About 70% of job applicants completed their application on mobile devices in 2022
Job Application Process
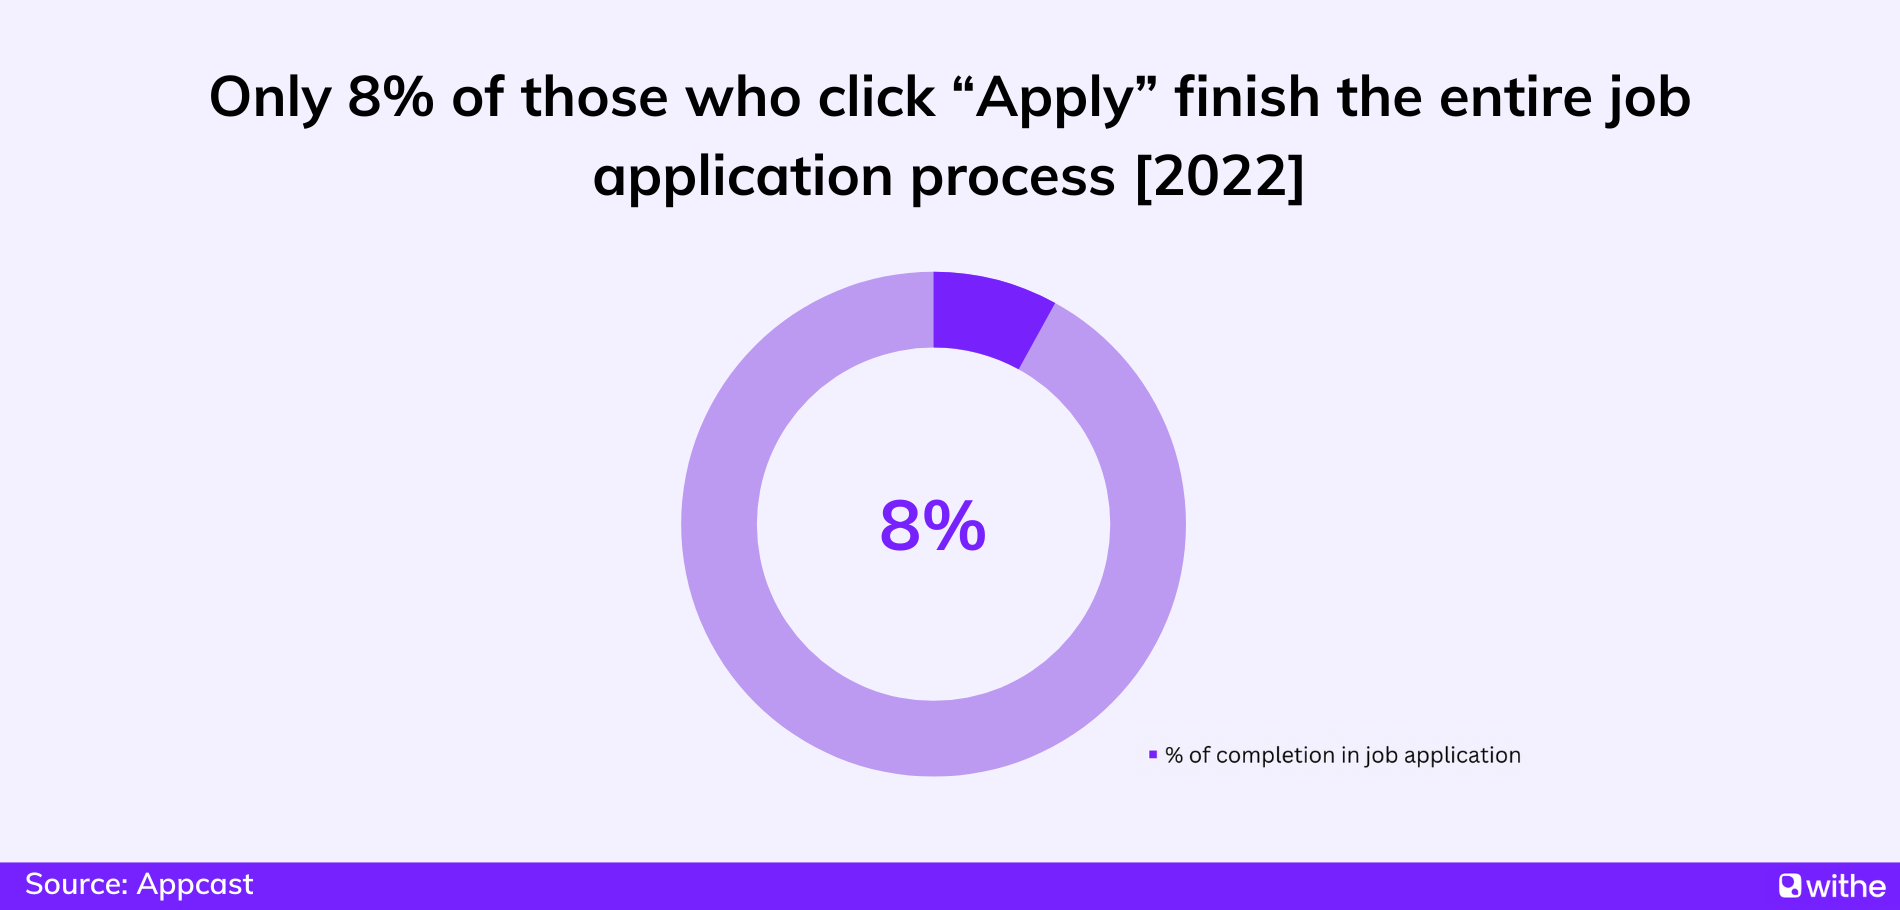
An astounding 92% of those who click “Apply” fail to finish the entire job application process (SHRM). In other words, there is a 92% drop-off rate in the application process.
60% of candidates quit in the middle of the online job application process because of the application length or complexity (SHRM).
49% of candidates would consider applying for a role instantly if the process appeared simple (Hays).
Candidates are 38% more likely to accept a job offer if they are satisfied with the application process (Glassdoor).
43% of companies say the application phase is the area where most candidates drop off (Fountain).
- 47% of candidates are dropping off due to finding other jobs
- 46% of candidates are dropping off due to poor candidate experience
95% of job seekers rate the ability to follow-up on application as the most important feature on a career website (Talentegy).
The survey by Talentegy also revealed:
- 56% of job applicants encountered a technical issue during the application process.
- 63% of job seekers who are dissatisfied with the communication after applying.
- 55% of job seekers indicated that they are rarely or never kept informed about their application status after completing an application.
- 75% of job seekers were never or rarely asked for feedback after submitting an application.
- 69% of job seekers are likely to provide the feedback for the application process
64% of job seekers spend time researching before applying after reading a job posting (CareerBuilder).
37% of job seekers move on to the next company or job listing if they can't find the info they need on the company (CareerBuilder).
58% of candidates expect to hear back from companies in one week or less regarding their initial application (Greenhouse).
76% of job seekers state that not hearing back after submitting a job application trumps the frustration of not hearing back after a first date (iCIMS).
93% of applicants who get offered a job within 24 hours accept them (Fountain).
Apply Rate
Apply Rate is the number of job seekers who visit a job posting and actually apply for the job.
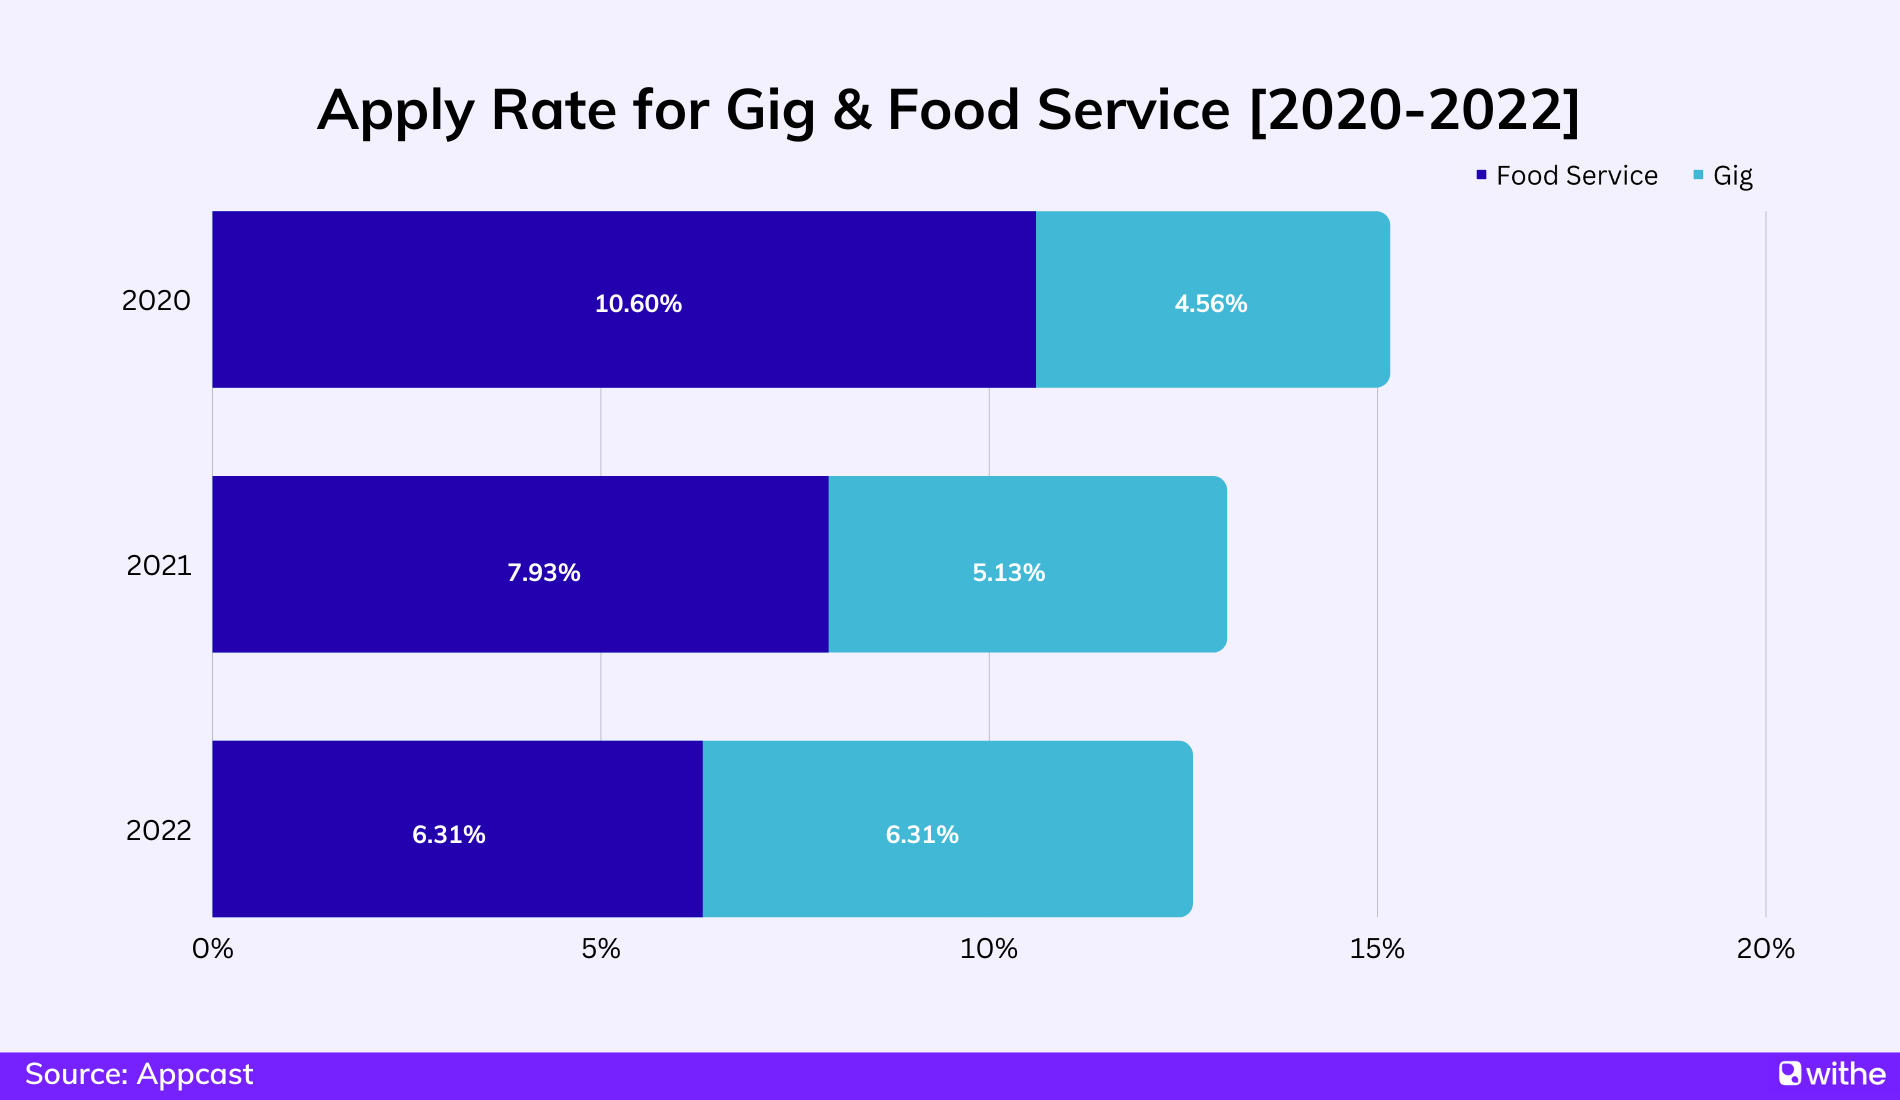
In 2022, both Gig and Food Service have the highest application rates, each at 6.31% (Appcast).
Technology follows at 5.97%, trailed by Finance at 5.87%, Customer Service at 5.62%, Security at 5.60%, and Hospitality at 5.46%.
While Gig has increased apply rate over the last three years, Food Service has seen a downward trend.
The length of job descriptions has an impact on apply rates (Appcast).
- Job descriptions containing 201-400 words have the highest apply rates of 8-8.5%.
- Job descriptions over 401 words result in decreased apply rates.
- Job descriptions under 200 words see appy rates hovering around 4.5%.
75% of candidates respond positively to job descriptions that use generic language, as opposed to more casual or formal tones (LinkedIn).
The number of questions also has an impact on apply rates (Appcast).
- 10.60% of apply rate: 1-25 questions
- 7.51% of apply rate: 26-50 questions
- 5.68% of apply rate: 50+ questions
Candidates with 50 or more questions are 46% less likely to apply compared to candidates with 25 questions or less.
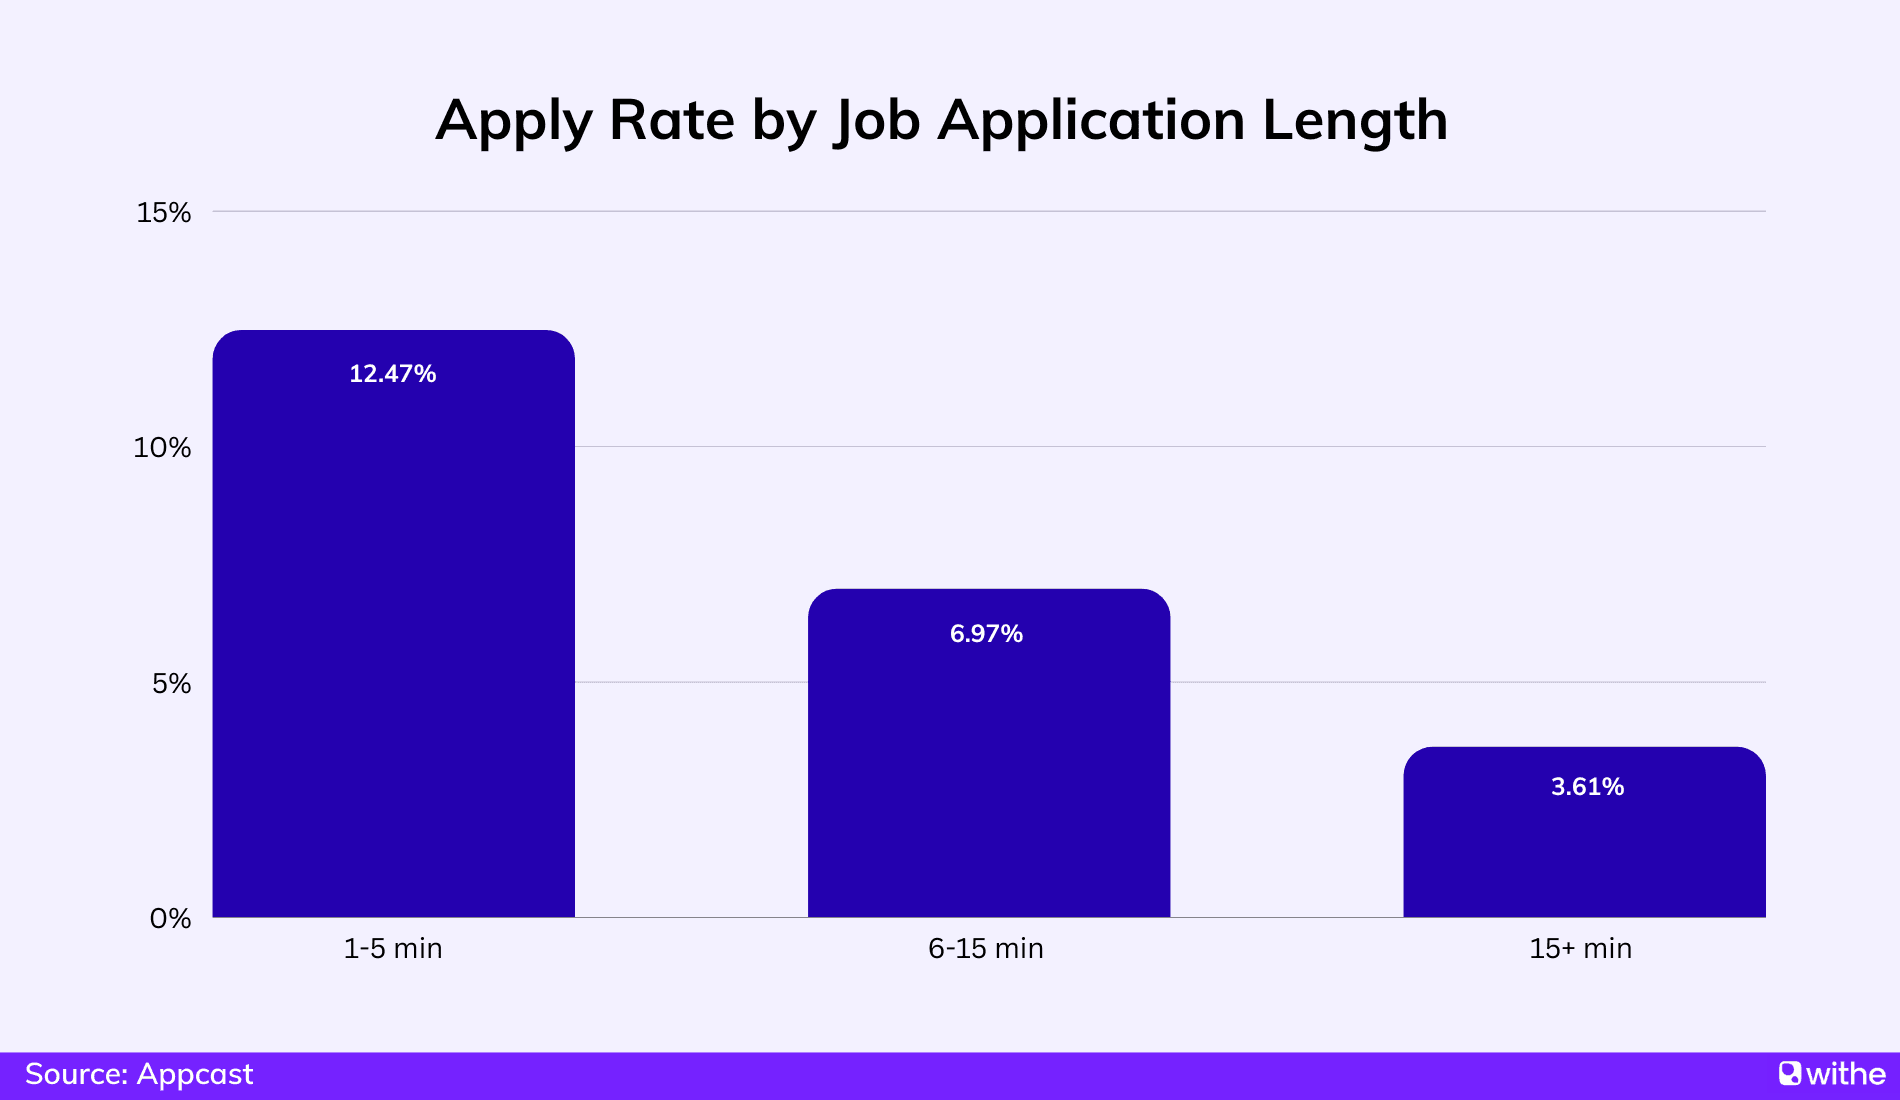
The length of job application also has an impact on apply rates (Appcast).
Job applications that take longer than 15 minutes to complete result in an apply rate of 3.61%, whereas those completed within 1 to 5 minutes have a notably higher apply rate of 12.47%.
Recruiters can boost conversion rates (candidates viewing a job ad who go on to complete an application) by up to 345 percent by reducing the length of the application process to five minutes or less.
73% of applicants abandon job applications if they take longer than 15 minutes (Hays).
1 in 3 companies state that the application process takes longer than 30 minutes for high-volume hiring roles (Fountain).
76% of job seekers want to know how long it will take to fill out an application before they apply (CareerBuilder).
However, the majority of job seekers said they would be willing to endure a lengthy application process if the company offered a higher base salary.
The average job application requires 51 clicks to complete (SHRM).
Mobile Apply
About 70% of job applicants completed their application on mobile devices in 2022 (Appcast).
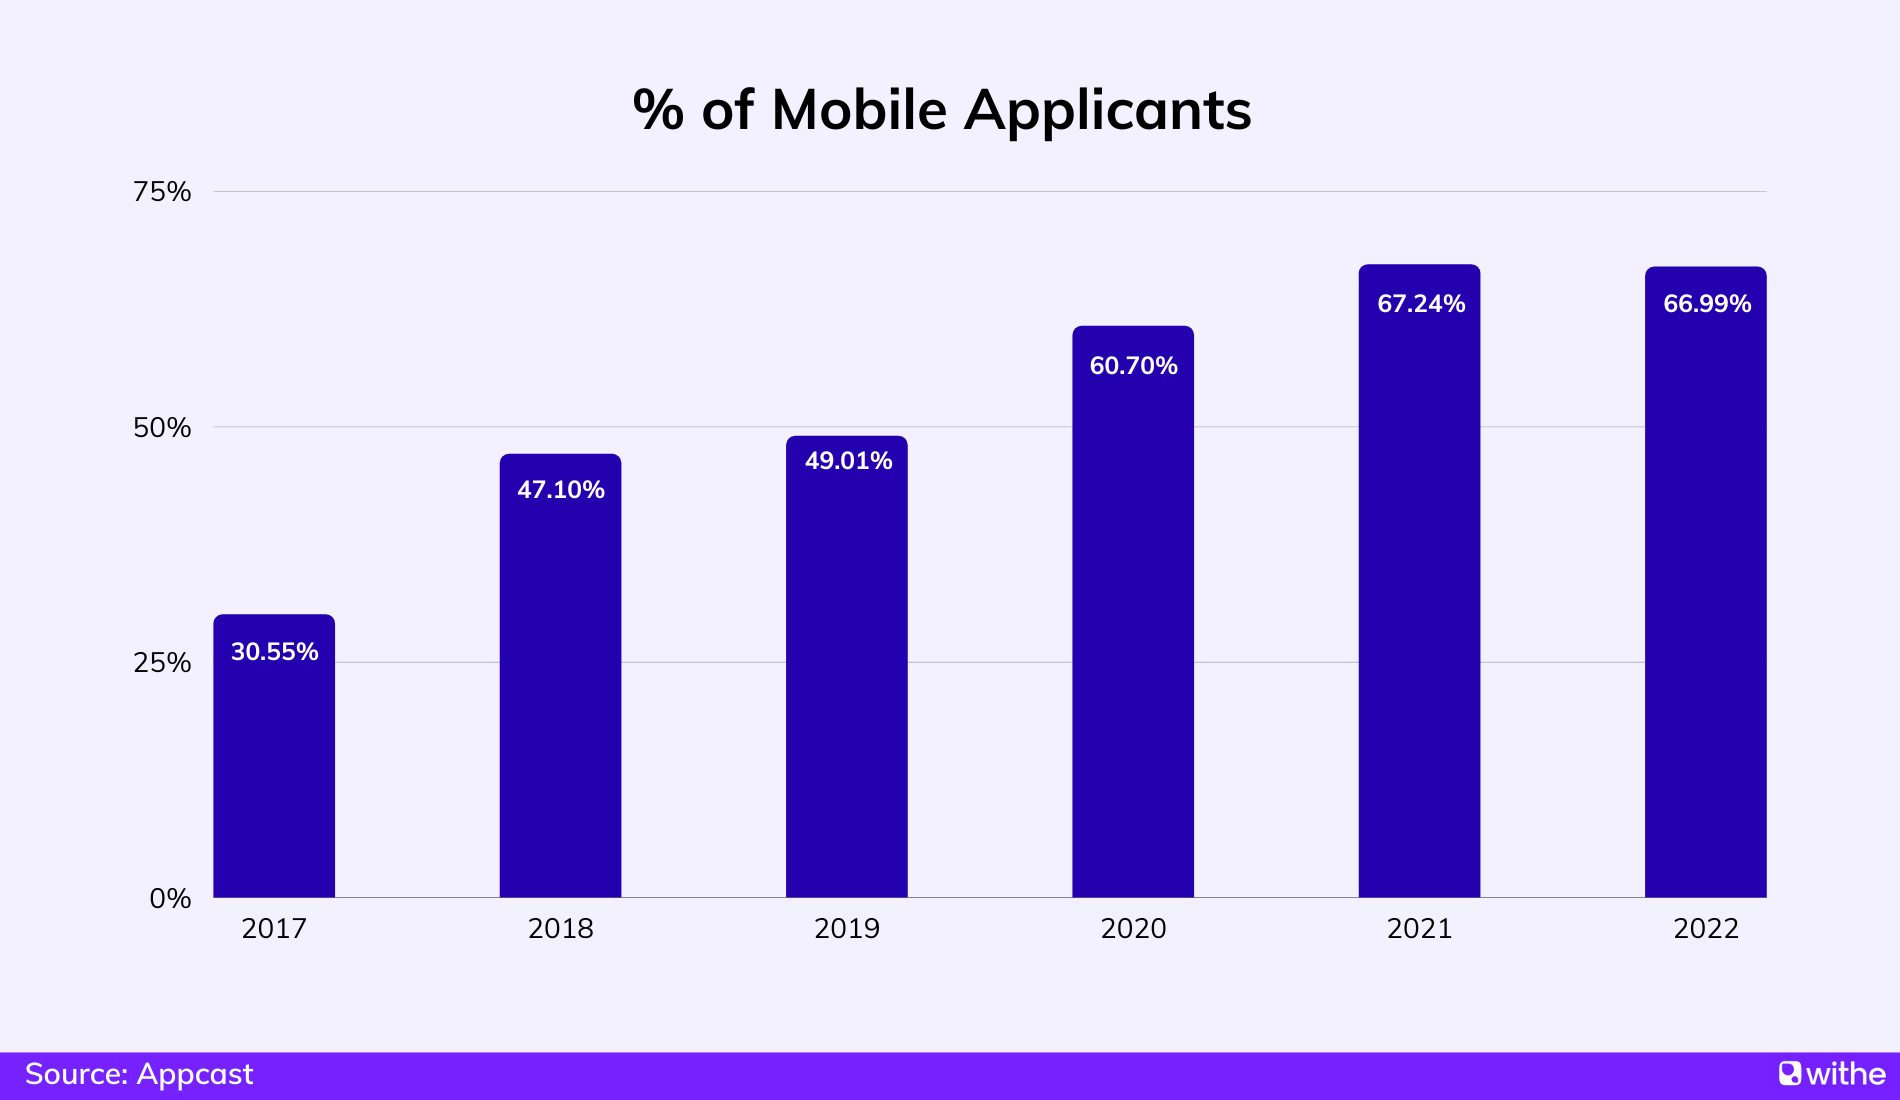
Mobile applications surpassed desktop applications for the first time in 2020, with almost 21% of increase from 2019.
Over the course of six years, from 2017 to 2022, the percentage of mobile applicants more than doubled, increasing from 30.05% to 66.99%.
| Year | % of Mobile Applicants | YoY Change | Total Applicants Surveyed |
|---|---|---|---|
| 2017 | 30.55% | - | 5 million applicants |
| 2018 | 47.10% | +56.48% | 5 million applicants |
| 2019 | 49.01% | +4.05% | 7 million applicants |
| 2020 | 60.70% | +23.79% | 7 million applicants |
| 2021 | 67.24% | +10.77% | 8 million applicants |
| 2022 | 66.99% | -0.37% | 12 million applicants |
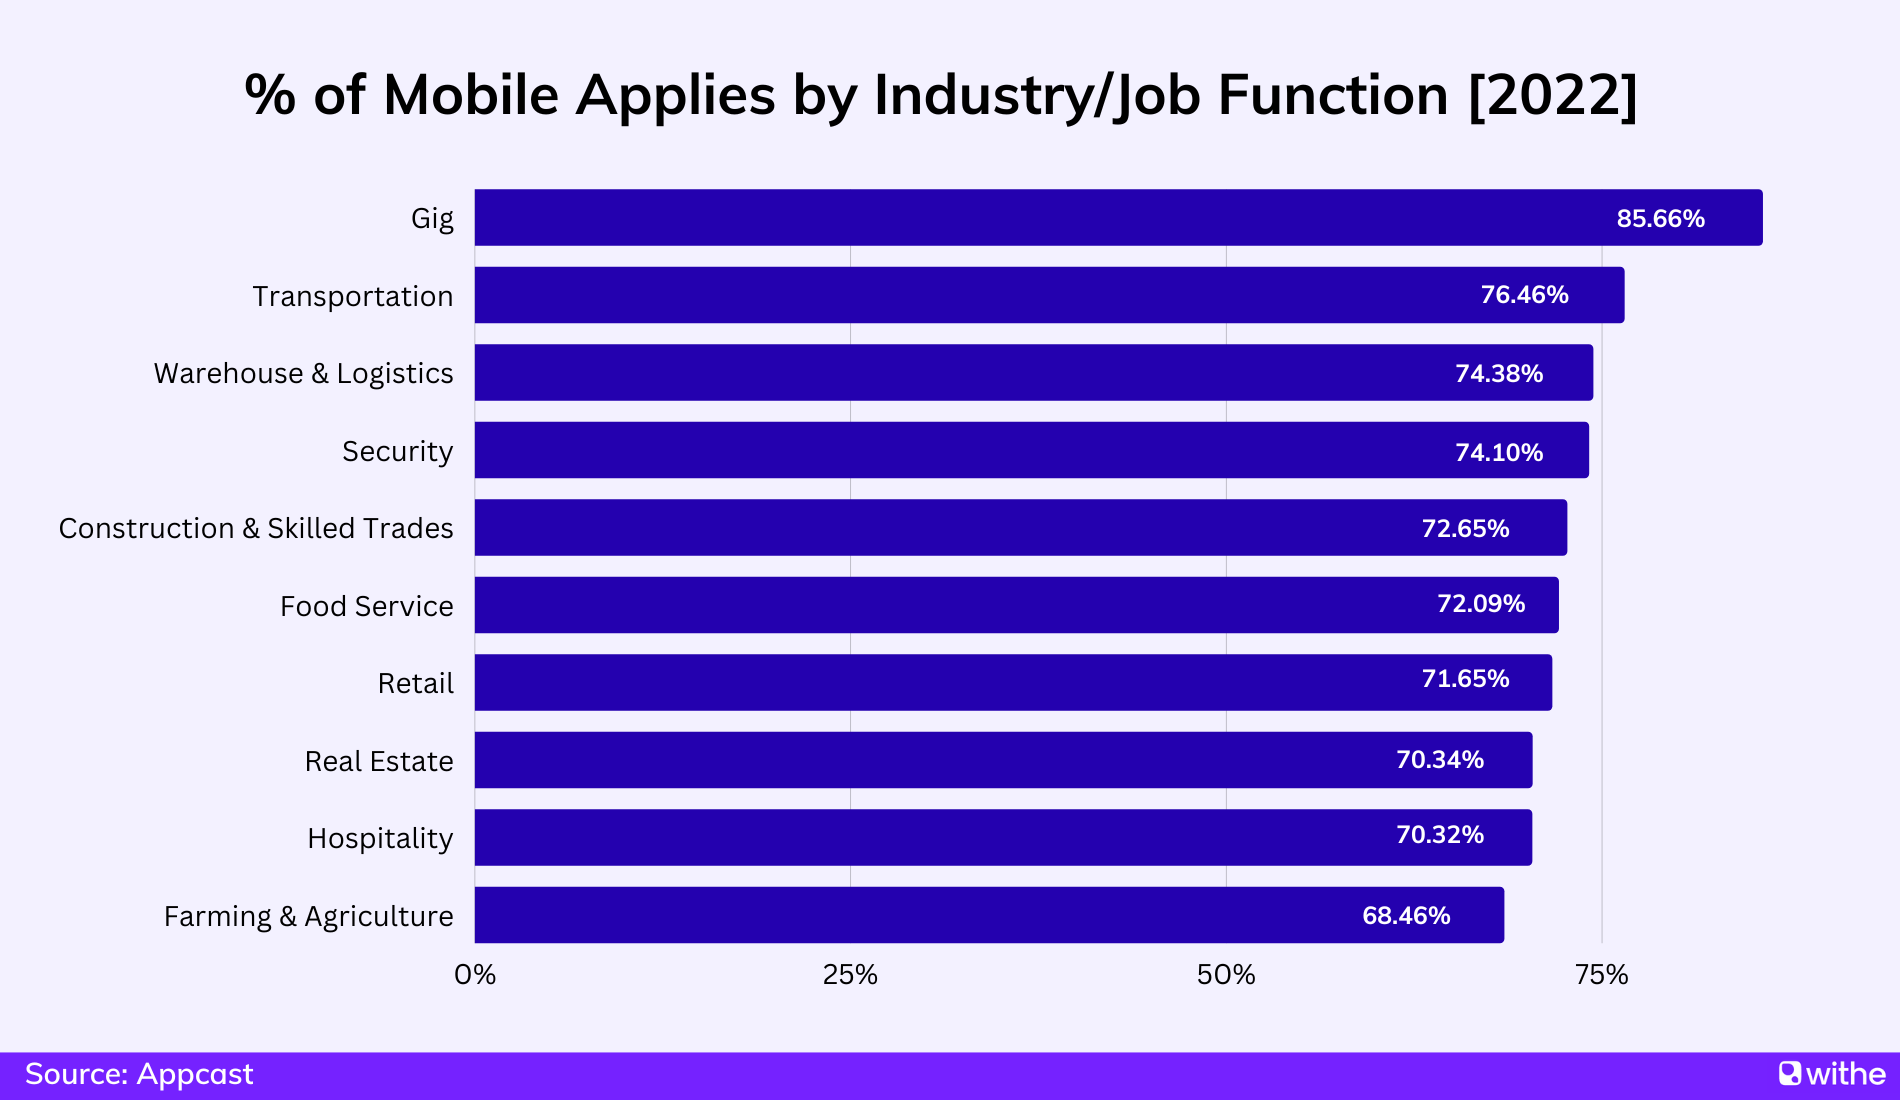
Mobile application rates have increased across the board, and here are the top five industries/job functions in 2022, ranked by the percentage of applications submitted via mobile devices - 24 industries/job functions surveyed.
Gig has the highest percentage of mobile applications, at 85.66%. This is followed by Transportation (76.46%), Warehousing & Logistics (74.38%), Security (74.10%), and Construction & Skilled Trades (72.65%).
The healthcare sector has seen the most significant surge in mobile applications, experiencing an impressive growth rate of nearly 41% from 24.59% in 2018 to 65.97% in 2022.
Here are the top 5 industries/job functions that saw a significant increase in mobile applications.
| Industry or Job Function | Mobile Applicants in 2018 | Mobile Applicants in 2022 | % of Change |
|---|---|---|---|
| Healthcare | 24.59% | 65.97% | +41.38% |
| Science & Engineering | 13.83% | 52.23% | +38.40% |
| Retail | 50.10% | 71.65% | +21.55% |
| Administration | 37.28% | 57.74% | +20.46% |
| HR & Staffing | 28.59% | 42.00% | +13.41% |
Conclusion
The job application process is evolving quickly. Winning in today’s hiring market means companies should focus on mobile-first technology, a simple and streamlined application process, as well as improved communication. Employers who embrace these trends are more likely to succeed in attracting and retaining top talent in today's competitive job market. Staying informed about these application statistics is crucial for anyone involved in hiring to make informed decisions that benefit both job seekers and employers.
Continue your exploration into the vital statistics of talent acquisition – we've got you covered:
- Top of the talent acquisition funnel: 30+ Employer Brand Statistics
- Middle of the talent acquisition funnel: 50+ Job Interview Statistics and 50+ Candidate Experience Statistics
- Bottom of the talent acquisition funnel: 10+ Job Offer Statistics and 80+ Employee Onboarding Statistics