Leverage Withe's hiring event platform
Streamline your seasonal and high-volume hiring process and hit your hiring targets.
Career fairs are held to make an impact. Whether or not that story is told depends on how you measure it. When funders are involved, it's even more important. The thing to prove is that job seekers met employers who were hiring, and that those meetings led to employment opportunities. For a funded fair, that proof decides whether the program runs again.
A headcount and a wall of employer logos only prove that the event happened. To make the case for turning a one-off fair into a recurring program, organizers need to demonstrate its impact through metrics such as the share of registrants who attended, employer participation, candidate-employer connections, satisfaction on both sides, and post-event outcomes.
This post is for chambers of commerce, employment centres, workforce agencies, and other public-sector organizers with a reporting obligation. It draws on Withe's Career Fairs That Make an Impact guide, built from hundreds of career fairs across Canada and the US.
Leverage Withe's hiring event platform
Streamline your seasonal and high-volume hiring process and hit your hiring targets.
What do funders want to see in a career fair report?
Funders want evidence that a career fair had tangible outcomes for job seekers and employers. That evidence falls into five categories: attendance, employer participation, candidate engagement, candidate-employer connections, and employment outcomes after the fair. The categories build on each other: job seekers attend, connect with employers and resources hiring, and those connections and conversations lead to hiring outcomes.
Public workforce funders already measure programs this way. In the US, WIOA, the main federal workforce law, uses six primary performance indicators, including employment in the second and fourth quarters after exit, median earnings, and effectiveness in serving employers (U.S. Department of Labor). In Canada, Ontario's 2017 Employment Service Program Guidelines tracked outcomes at exit and at 3, 6, and 12 months, and asked clients and employers to rate, from 1 to 5, how likely they were to recommend the service (Employment Ontario). Under Ontario's newer Integrated Employment Services model, 20% of a Service System Manager's budget is outcomes-based, according to a 2023 staff report (City of Toronto).
Even though one career fair cannot produce a 12-month employment rate, a funder who manages programs against these indicators reads the fair report the same way: employment, value to employers, and follow-up. Nonprofit funders ask for outcome data too. In Nonprofit Finance Fund's 2014 survey of more than 5,000 nonprofits, more than 70% said funders requested impact or program metrics (Nonprofit Quarterly). A career fair report written in those terms shows a funder how one event feeds the program's larger results.
Which career fair metrics should you track?
Track nine metrics that ladder up from activity to outcome. The first five show who came and what happened in the room. The last four, drawn from feedback and follow-up, show what the fair changed, and funders treat them as outcomes. Each metric has a fixed formula, so results compare from one fair to the next.
| Metric | How to calculate | What it shows a funder |
|---|---|---|
| Registration source distribution | Registrations per channel ÷ total registrations | Which channels attracted job seekers and employers to the fair. |
| Registration-to-attendance rate | Attendees ÷ valid registrations | Whether outreach reached people who showed up |
| Employer participation | Employers attending, share of committed employers who showed up, roles hiring | Hiring demand in the room |
| Connections per employer | Connections ÷ employers attending | Contact at each booth |
| Connections per employer per hour | Connections per employer ÷ hours open | Booth activity, comparable across fair lengths |
| Employer outcome rate | Employers who met qualified candidates ÷ employer feedback respondents | Value to employers |
| Candidate connection rate | Candidates who found an employer to follow up with ÷ candidate feedback respondents | Value to job seekers |
| Immediate feedback | After the fair, collect candidate and employer feedback on satisfaction, connections made, and perceived value. | Immediate participant satisfaction and perceived value |
| Post-fair employment outcomes | Candidates reporting an interview, offer, or hire ÷ candidates surveyed at 30 and 90 days | Whether the fair led to work |
Capturing this data allows you to benchmark for your future events. As a baseline, there are existing benchmarks for attendance and no-show rates. Benchmarks tell a funder whether a result is strong, and two of these metrics have published ones. A 2026 analysis of more than 1,070 events found a median no-show rate of about 28% for free events and 17% for paid ones (PheedLoop), which implies roughly 72% attendance at a free event (derived). In the 2024 Student Survey, more than 45% of students who attended a career fair got an interview invitation and nearly one-quarter got a job offer (NACE). Those are campus results and may not transfer to community fairs.
Cost rounds out the picture for funders comparing programs. Divide total event cost by connections to get a cost per connection (derived). Eventus put a virtual career fair at $4,000 to $15,000+ in 2021 (Eventus), and Remo puts an in-person fair at up to $30,000 (Remo).
Withe turns registrations, check-ins, and booth connections into one post-fair report you can send to funders.
How do you collect career fair data for a funder report?
A funder report is only as convincing as the data captured on the day. Collect career fair data at five points: registration, check-in, booth connections, feedback, and follow-up. Each point adds the next part of the story, from who signed up to who got hired. Capture data as it happens, because it’s much harder to piece together the full picture the next day.
Registration data
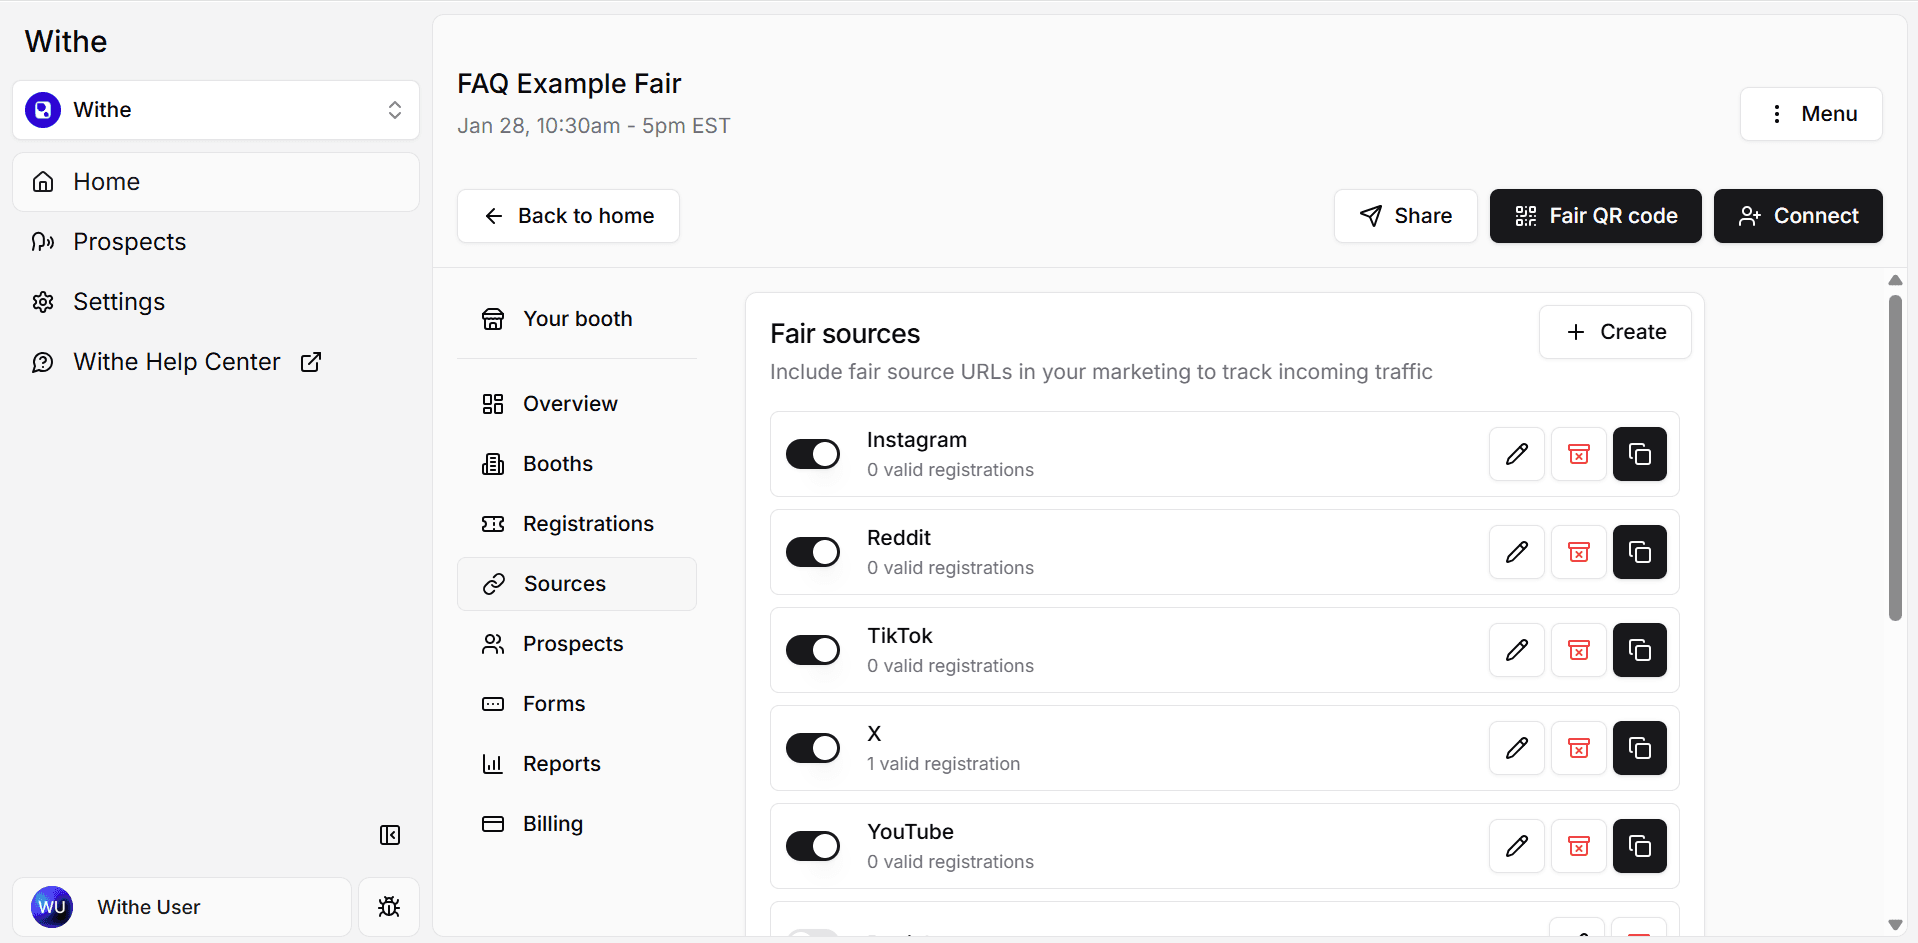
The registration form defines who the fair reached, so it sets up every number that follows. Collect the fields the funder needs, such as employment status, eligibility, and demographics, plus industries of interest and accessibility requests. Drop any field that will not feed reporting, matching, or follow-up, since shorter forms convert better. To measure source distribution, give each promotion channel its own trackable link, which Withe calls marketing sources.
Check-in data
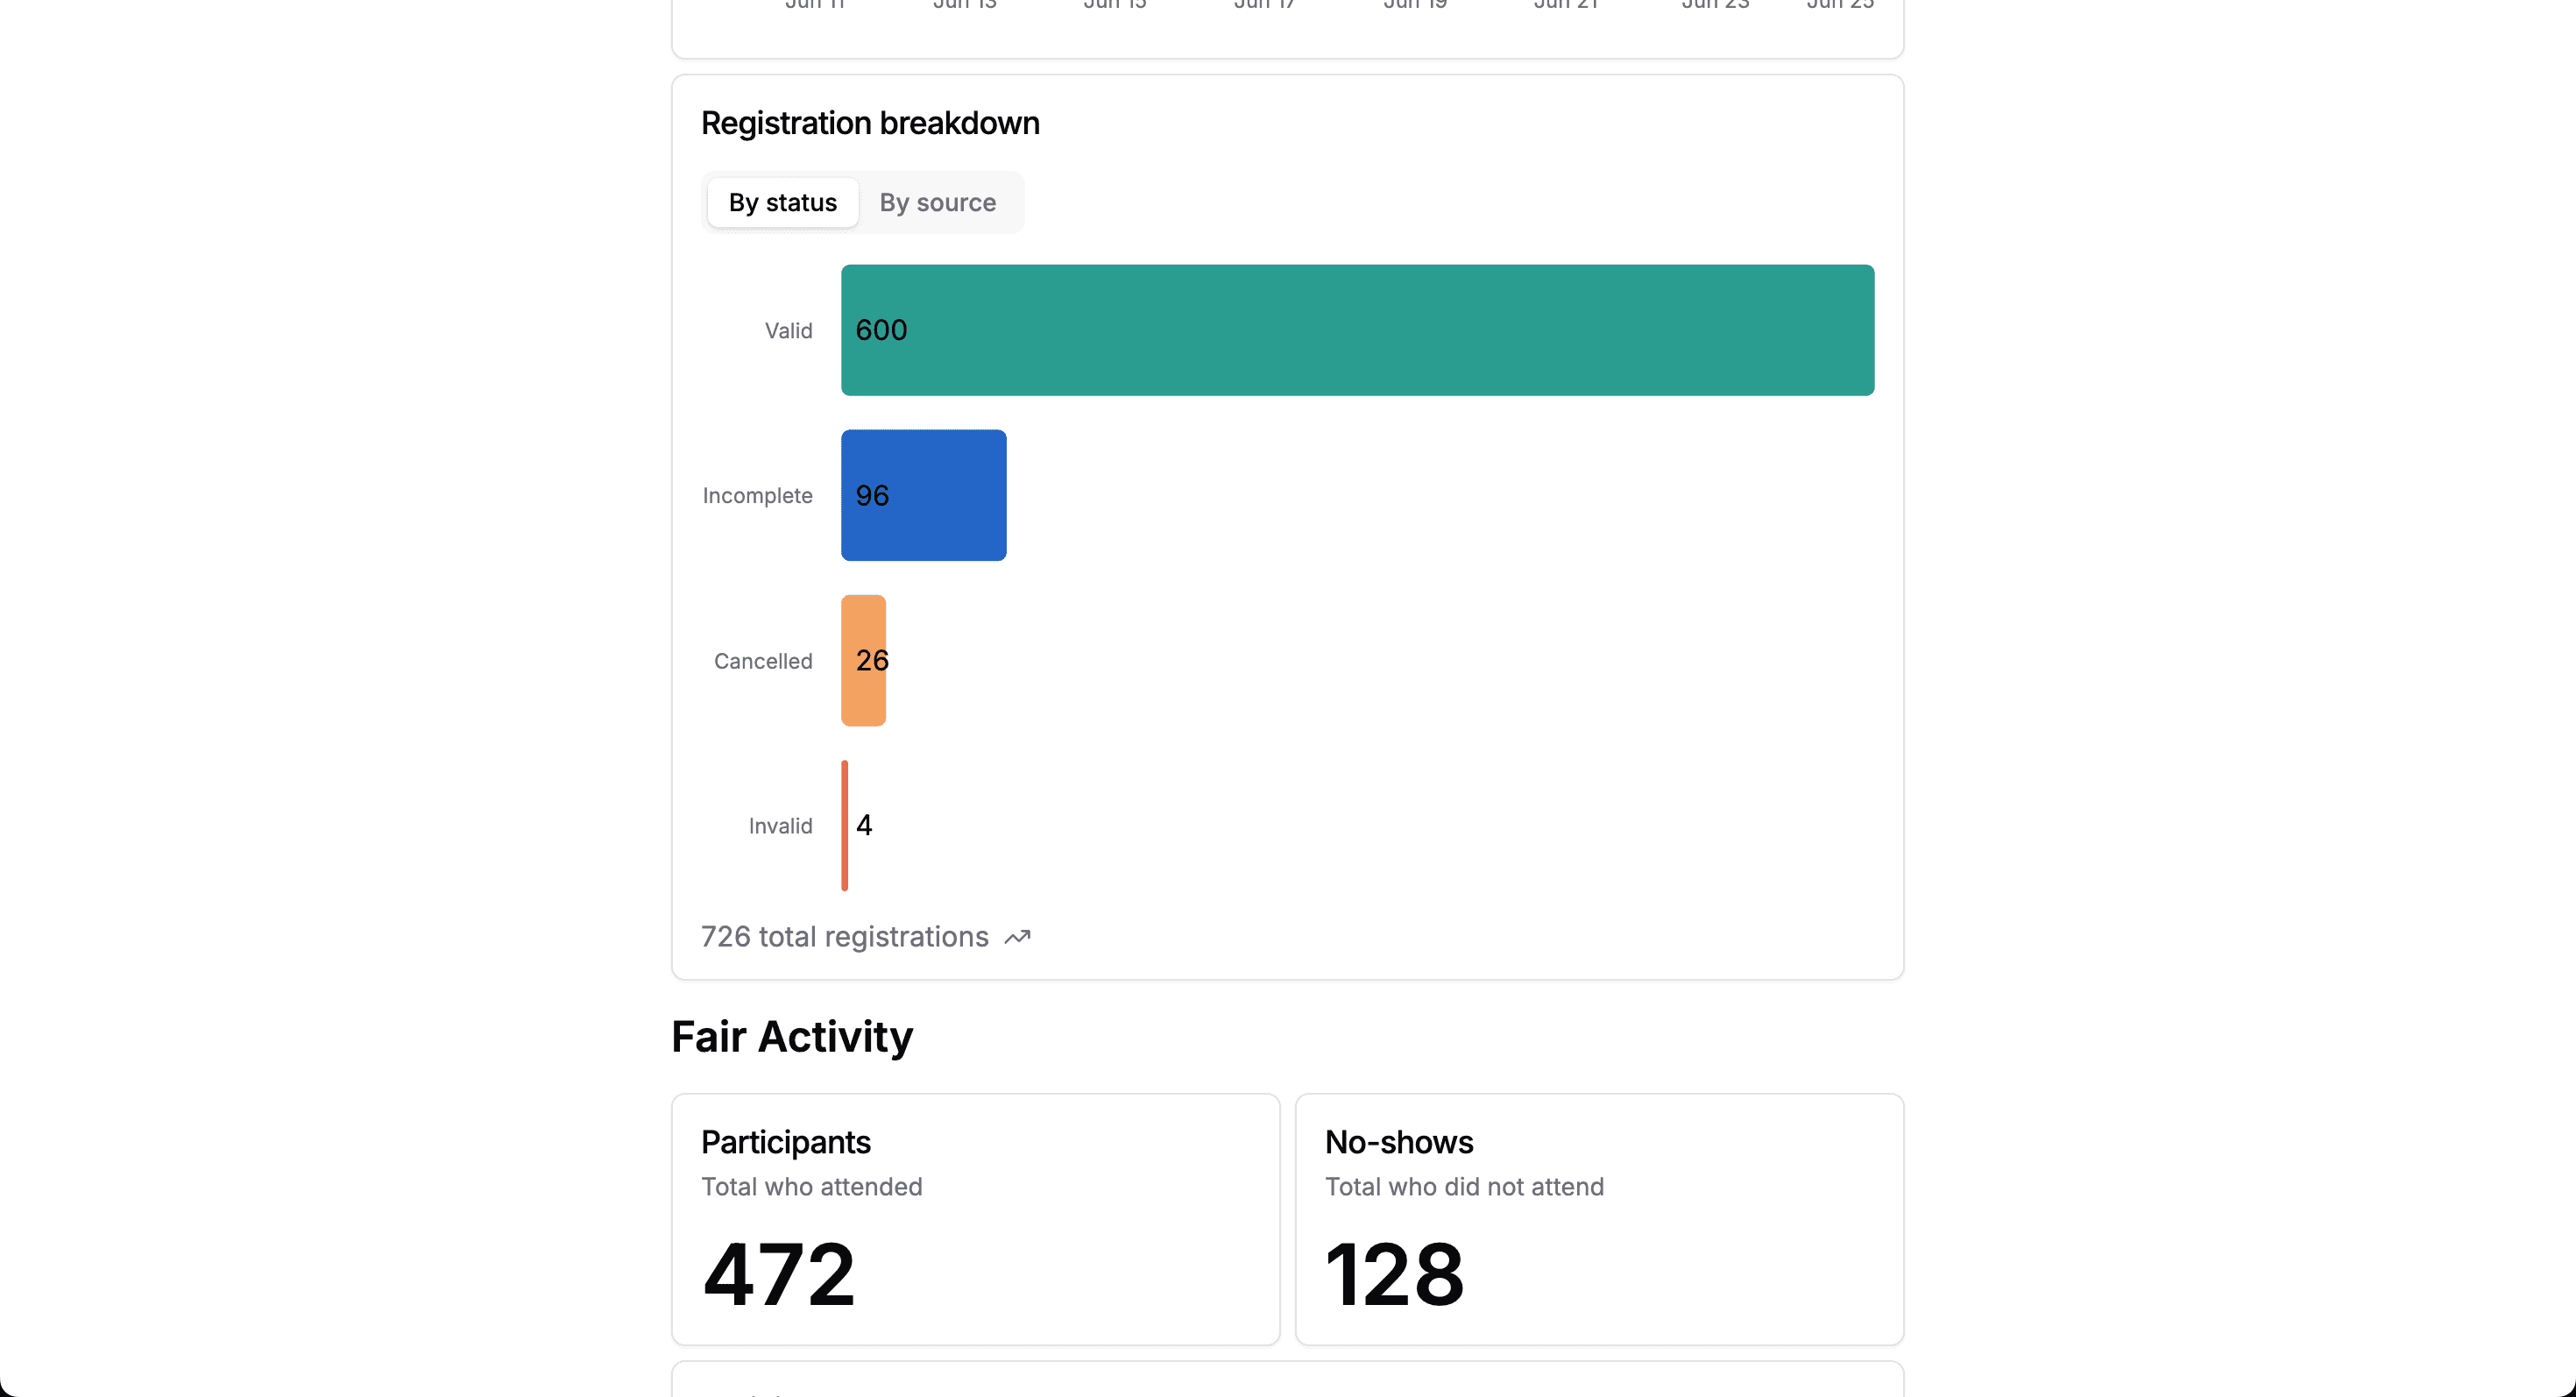
Check-in shows how many registrants turned up, which turns registrations into an attendance rate. One QR code at the entrance covers the opening rush. In Withe, a booth scan also counts as check-in, so late arrivals and people who skip the front desk are still recorded (participant check-in). Keep a paper sign-in sheet as a backup.
Employer connection data
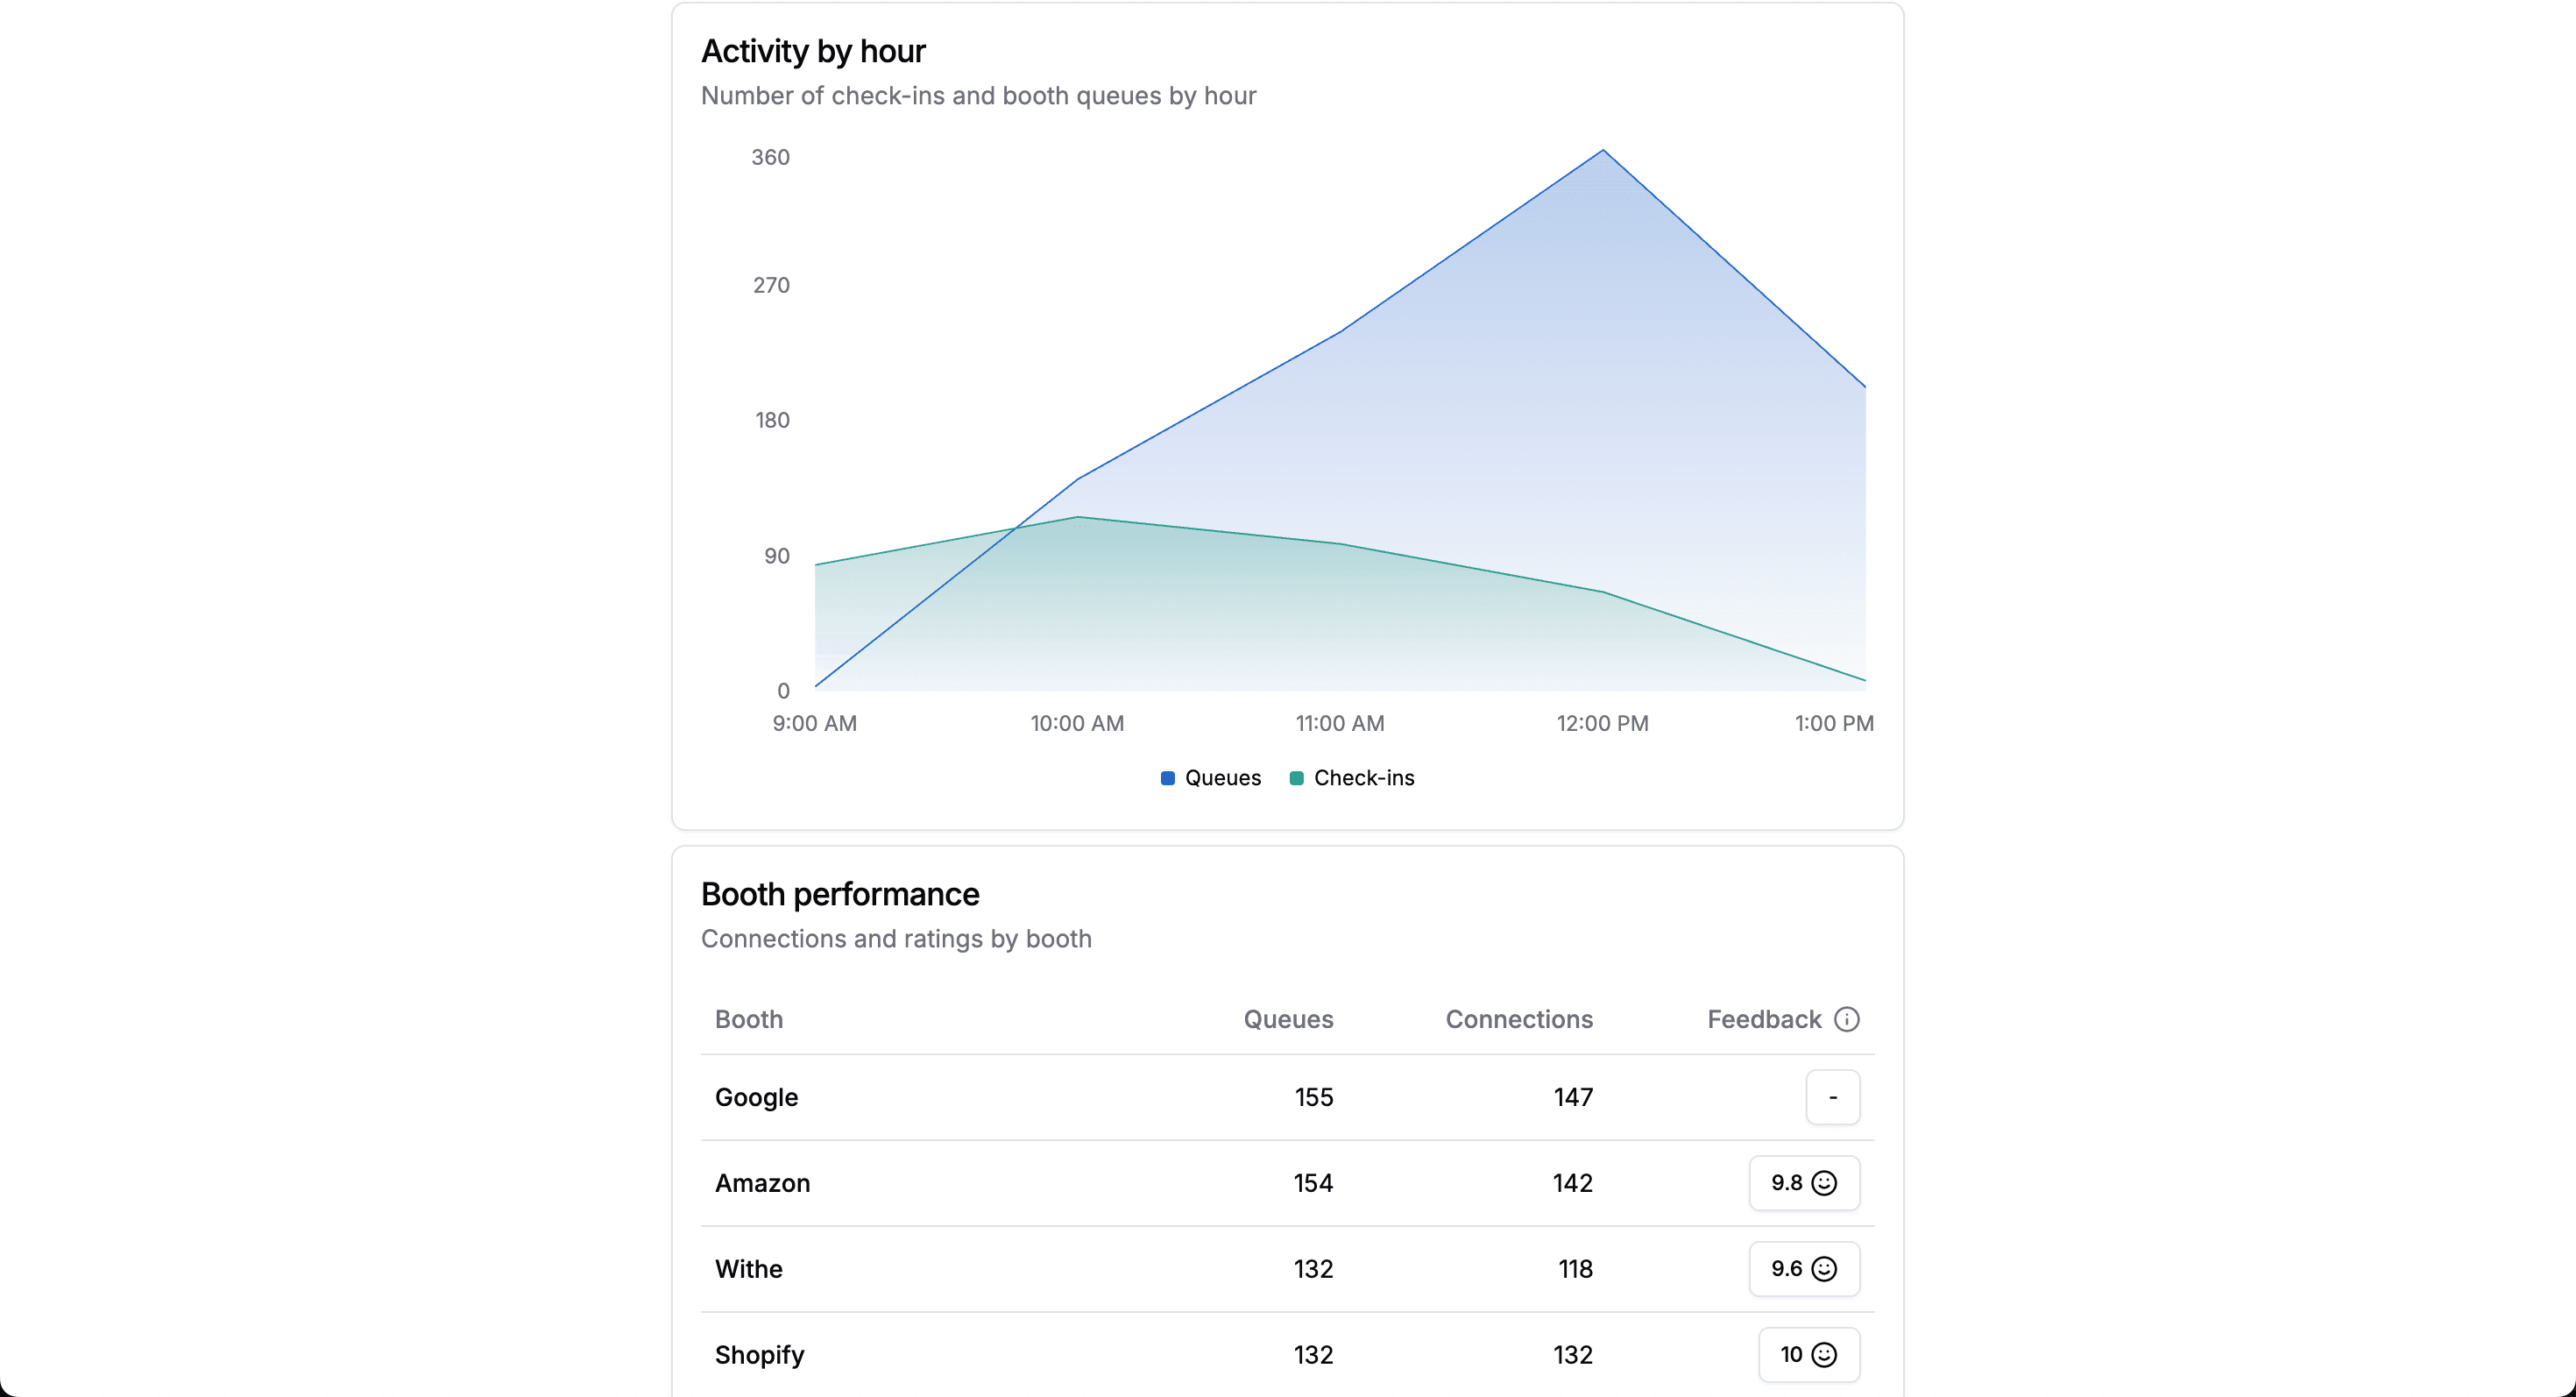
Connections are the evidence that job seekers and employers actually met, which makes connection data the core outcome metric. Booth QR codes capture connections most reliably: each scan creates a timestamped record and also produces booth-level counts and the hourly pattern.
Post-event feedback
Feedback forms record what candidates and employers thought of the day, and the answers supply the satisfaction and outcome-rate metrics. Send feedback forms within 24 hours. Ask candidates, "Did you connect with an employer you're interested in?" Ask employers, in 5 questions or fewer, whether they met qualified candidates and would return. Expect partial responses: 10% to 20% is a good rate for conferences and corporate events, according to a 2021 benchmark (Explori), so report the respondent count next to every percentage. Withe sends participant and booth feedback forms automatically 1 hour after the fair ends.
Follow-up outcome data
Follow-up shows whether the fair led to work, the result funders care about most. Employment outcomes need a second survey: at 30 and 90 days, ask candidates whether they interviewed, received an offer, or were hired, and ask employers how many people they hired from the fair. Programs that already follow up at 3, 6, and 12 months can add fair attendees to that schedule.
What should a career fair funder report include?
A career fair funder report should open with outcomes, because outcomes answer the funder's question, then use participation and engagement data to show how the fair got there, and close with lessons and next steps. Withe's guide describes the strongest post-fair reports as the ones that tell a story funders can act on. The structure below follows that story from result to evidence to plan.
Suggested report structure
- Outcome summary. 3 to 5 headline numbers against goals set before the fair.
- Participation. Registrations, attendance rate, employers, and roles.
- Engagement. Connections, connections per employer, booth highlights, and the hourly pattern.
- Feedback. Satisfaction scores, response counts, and a few quotes.
- Follow-up outcomes. Interviews, offers, and hires, with the number surveyed.
- Next steps. What changes next time, and a tentative date.
- Appendix. A raw data export (CSV) for compliance.
Give every metric a comparison
A number on its own leaves a funder guessing. Each headline number in a funder report needs a reference point: the target set before the fair, the previous fair, or an external benchmark. With a comparison attached, a figure becomes a finding. The example below applies the formulas to a hypothetical fair.
| Metric | Example result | Useful comparison |
|---|---|---|
| Registration-to-attendance rate | 67% (200 of 300) | The previous fair, and the roughly 72% implied for free events |
| Connections per employer | 21.3 (850 ÷ 40) | The previous fair, or employers in the same sector |
| Connections per employer per hour | 5.3 (21.3 ÷ 4 hours) | Fairs of a different length |
| Employer outcome rate | 92% met qualified candidates | The target set before the fair |
| Candidate connection rate | 87% plan to follow up with an employer | The previous fair |
Source data adds its own comparison, and it shapes the next fair's promotion plan: the channel that felt productive, such as daily Instagram posts, often differs from the one that drove registrations, such as a partner email.
Match the format to the reader: a formal submission for a government funder, a one-page summary for a board, and raw data for the internal team.
How can you make funder reporting easier?
Funder reporting is easiest when the data never has to be stitched together. Keep registration, attendance, employer engagement, and outcomes in one system, and choose the report's metrics before the career fair. With every data point on one record, the funder report is mostly built by the time the doors close.
Withe recommends setting 3 to 5 measurable outcomes before booking a venue, working backward from any funder requirements. Deciding the report structure first tells the team what to capture on the day. The guide's after-the-fair checklist has the report drafted within 1 week and delivered within 2 to 3 weeks.
Withe Career Fairs is built on that single record. Registrations, source links, check-ins, booth scans, and feedback feed one post-fair report covering registrations by status and source, attendance and no-shows, hourly activity, booth performance, and feedback ratings. Organizers can share the report through a public link that needs no Withe account and export prospects as a CSV.
Conclusion
A career fair report that follows the thread from registration to hire gives a funder a reason to back the next fair. Before the next career fair, choose the 3 to 5 outcomes the report will lead with and schedule the 30- and 90-day follow-up surveys. Every other step in this post depends on those two decisions.
Withe helps career fair organizers capture every connection and prove outcomes to the people who fund them. Book a demo.
More resources for career fair organizers: